
Hello, there are times when we have errors in cacti which we see that it does not show graphics…. This is usually easy to fix.
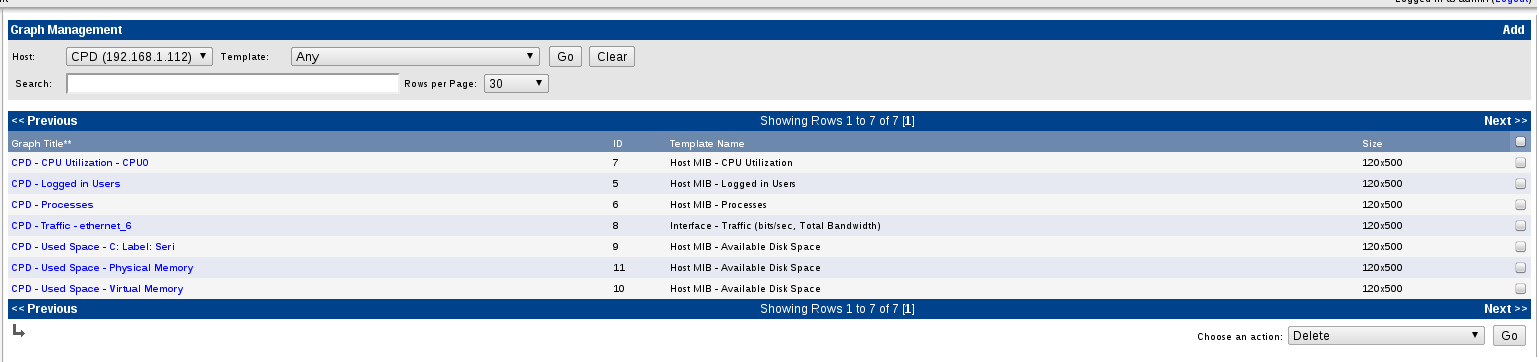
If we go to Grash List within our device

We select the graph that is giving us an error.
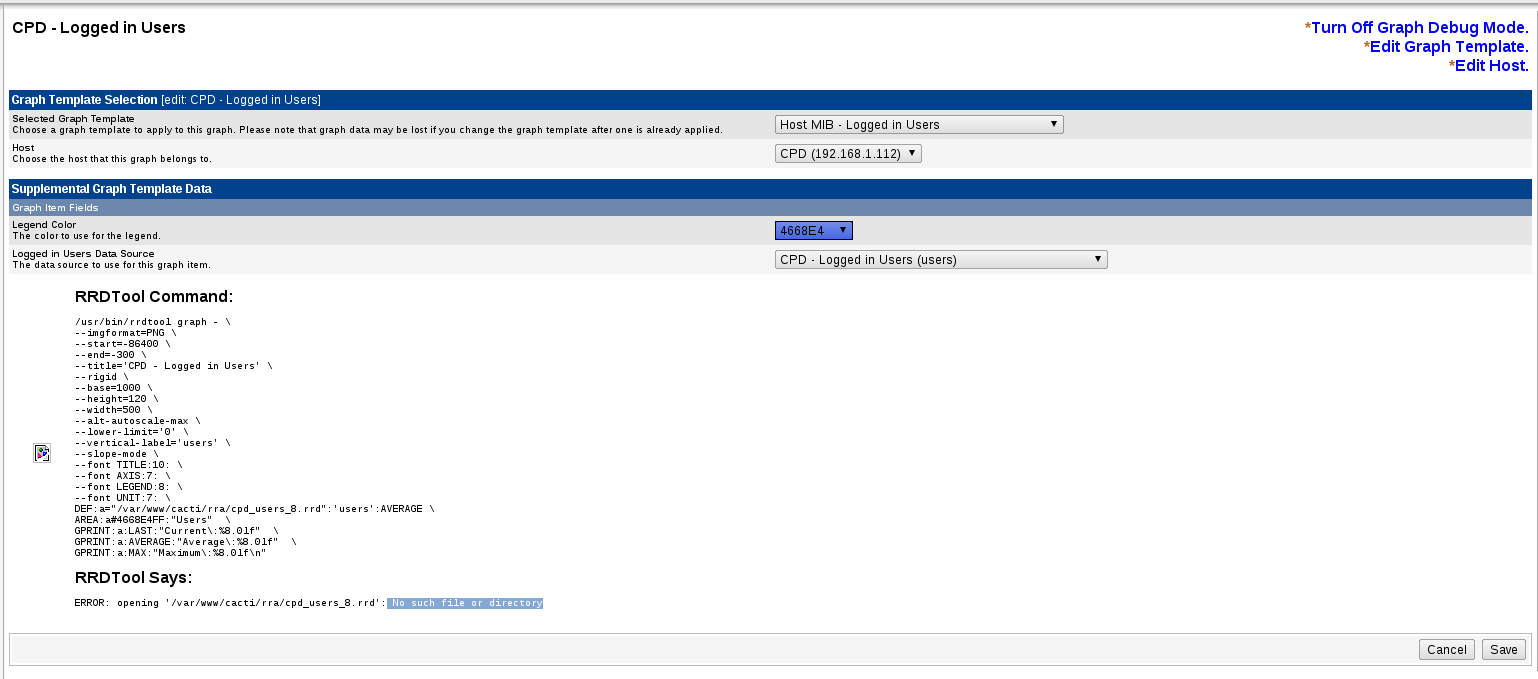
Once inside we click on debug (*Turn On Graph Debug Mode) and the following error will appear:
ERROR: opening ‘/var/www/cacti/rra/cpd_users_8.rrd’: No such file or directory
We log in to our server and perform the following steps
root@cacti:~# crontab -e
and we add the following line:
*/5 * * * * /usr/bin/php /var/www/cacti/poller.php >/dev/null 2>/var/www/cacti/log/poller-error.log
And we execute the following command
root@cacti:~# php /var/www/cacti/poller.php
PHP Warning: PHP Startup: Unable to load dynamic library ‘/usr/lib/php5/20090626+lfs/gd.so’ – /usr/lib/php5/20090626+lfs/gd.so: cannot open shared object file: No such file or directory in Unknown on line 0
PHP Warning: PHP Startup: Unable to load dynamic library ‘/usr/lib/php5/20090626+lfs/gd.so’ – /usr/lib/php5/20090626+lfs/gd.so: cannot open shared object file: No such file or directory in Unknown on line 0
OK u:0.02 s:0.00 r:0.73
OK u:0.02 s:0.00 r:0.74
OK u:0.02 s:0.00 r:0.77
OK u:0.02 s:0.00 r:0.77
OK u:0.02 s:0.00 r:0.87
OK u:0.02 s:0.00 r:0.87
OK u:0.02 s:0.00 r:0.92
OK u:0.02 s:0.00 r:0.97
OK u:0.02 s:0.01 r:1.02
OK u:0.02 s:0.01 r:1.07
OK u:0.02 s:0.01 r:1.11
OK u:0.02 s:0.01 r:1.17
OK u:0.02 s:0.01 r:1.21
OK u:0.02 s:0.01 r:1.27
06/29/2012 11:59:09 AM – SYSTEM STATS: Time:1.5696 Method:cmd.php Processes:1 Threads:N/A Hosts:3 HostsPerProcess:3 DataSources:11 RRDsProcessed:7
Y listo!!! si vamos de nuevo a nuestro debug ya tendría que aparecer OK
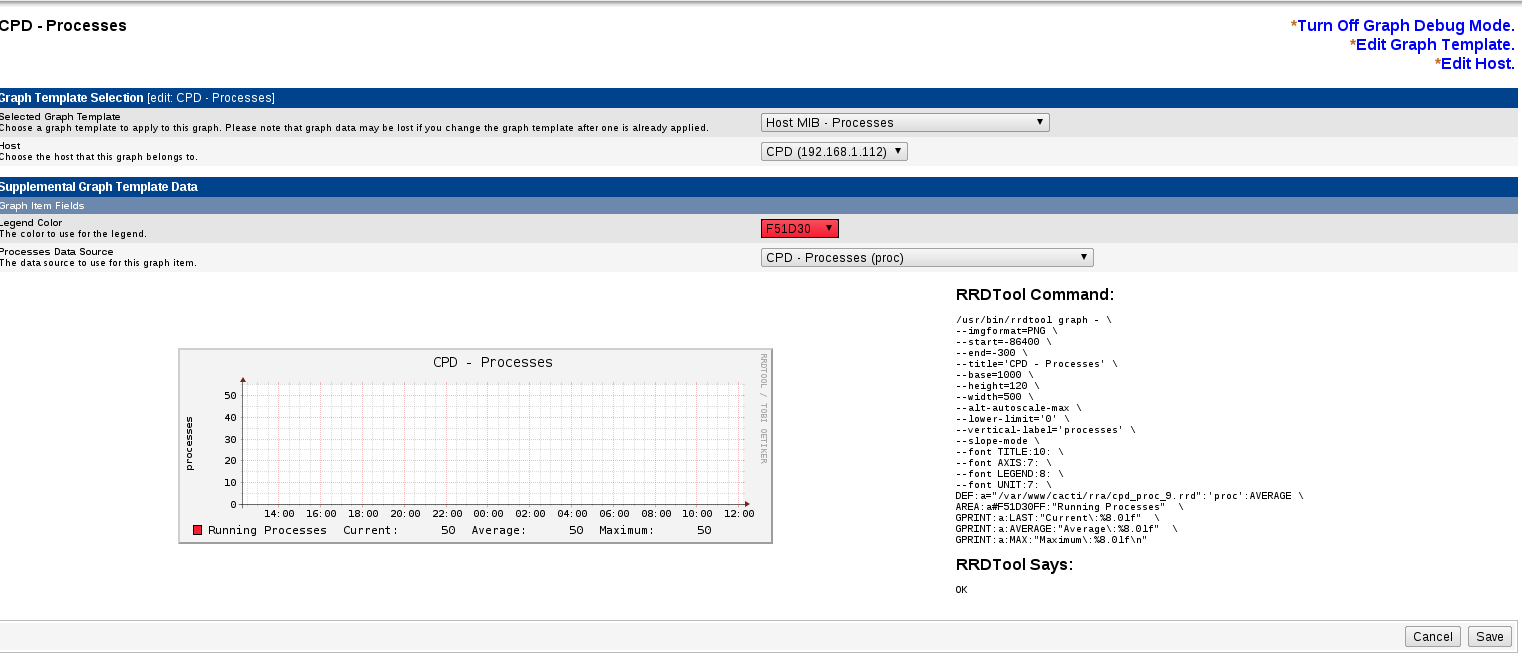
If this doesn't work... we can create the graph by hand
root@cacti:~# /usr/bin/rrdtool graph - \
--imgformat=PNG \
--start=-86400 \
--end=-300 \
--title='CPD - CPU Utilization - CPU0' \
--rigid \
--base=1000 \
--height=120 \
--width=500 \
--alt-autoscale-max \
--lower-limit='0' \
--vertical-label='percent' \
--slope-mode \
--font TITLE:10: \
--font AXIS:7: \
--font LEGEND:8: \
--font UNIT:7: \
DEF:a="/var/www/cacti/rra/cpd_cpu_10.rrd":'cpu':AVERAGE \
AREA:a#FF0000FF:"CPU Utilization"  \
GPRINT:a:LAST:"Current\:%8.0lf"  \
GPRINT:a:AVERAGE:"Average\:%8.0lf"  \
GPRINT:a:MAX:"Maximum\:%8.0lf\n"
we give permissions
chmod 777 /var/www/cacti/rra/cpd_cpu_10.rrdGreetings, rokitoh!
Comments