

To monitor VMware ESXI servers we are going to install vSphere SDK for Perl
You can see the manual under Debian here:
https://red-orbita.com/?p=5476
Once installed vSphere SDK for Perl We download the check that we are going to use for monitoring.
We download the Template and the script to monitor it
https://red-orbita.com/archivos/esxi.xml
http://git.op5.org/git/?p=nagios/op5plugins.git;a=blob_plain;f=check_vmware_api.pl
We load the template
Import Templates > We add the esxi.xml file downloaded previously > Import
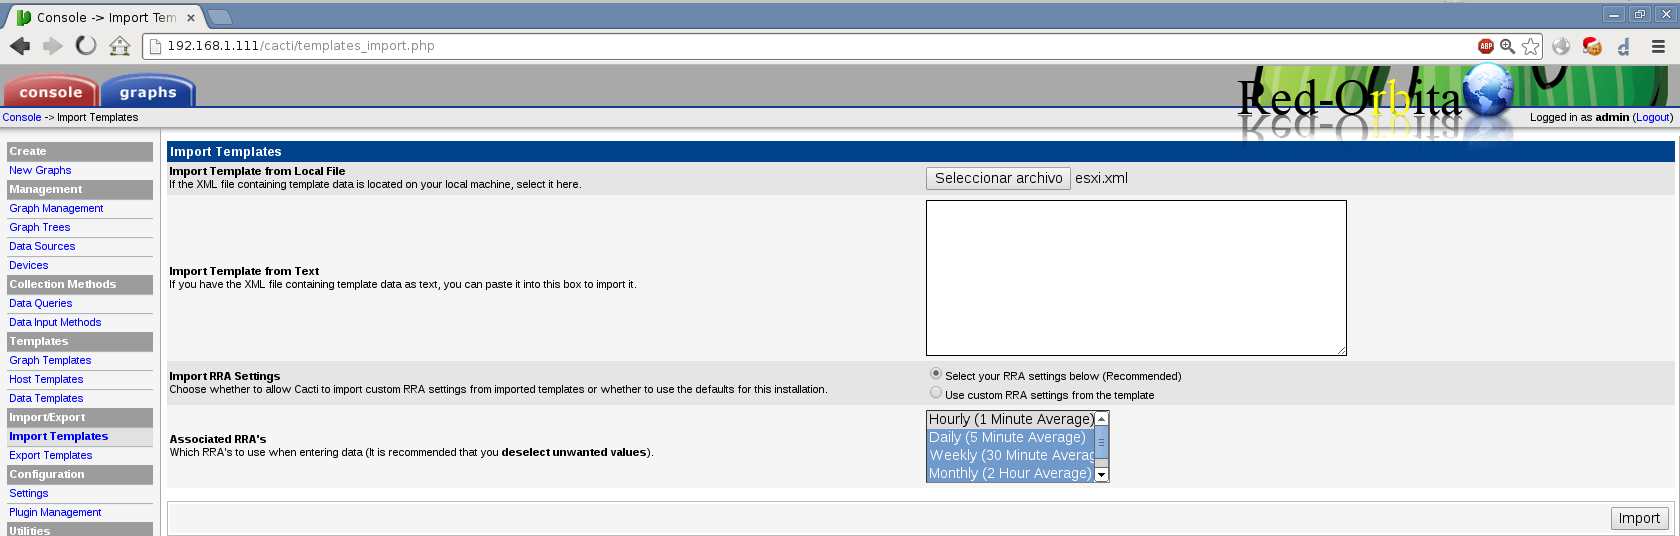
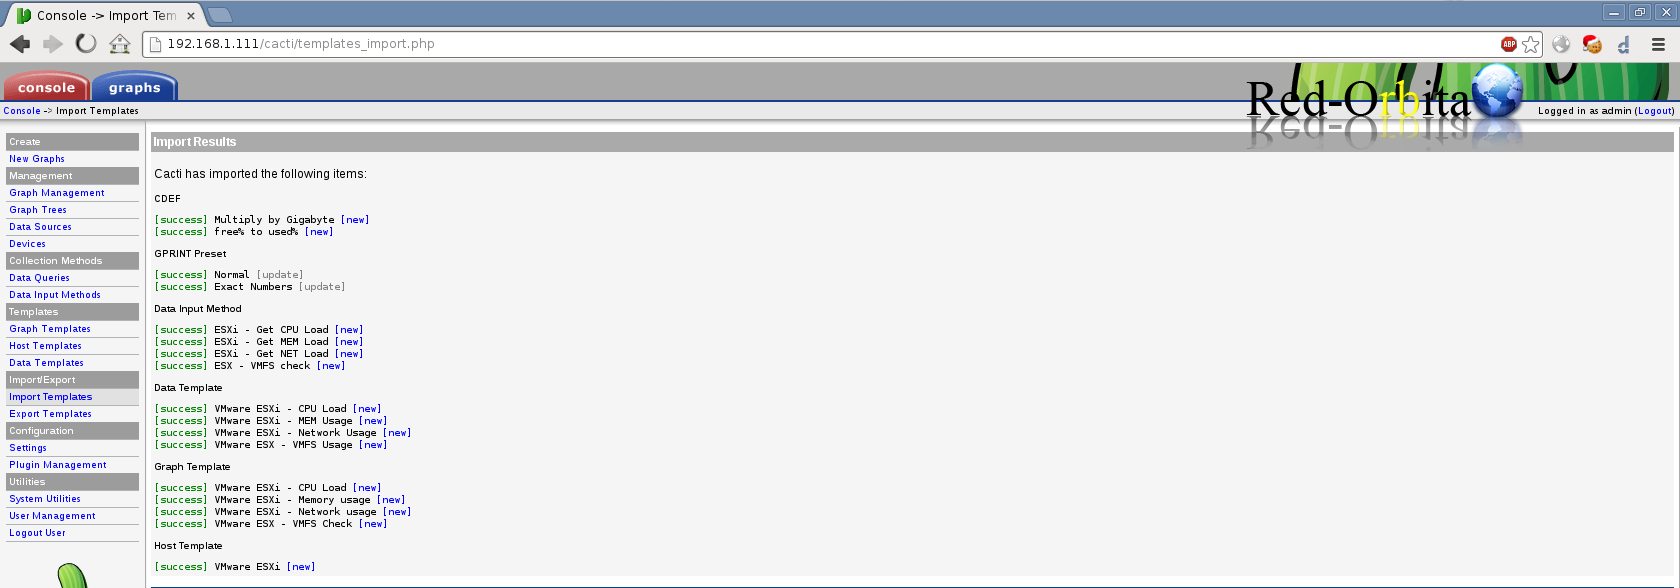
Once the Templete is added we move the check_vmware_api.pl script to the cacti script directory.
mv check_vmware_api.pl /var/www/cacti/scripts/We add the following script to the path /var/www/cacti/scripts/:
CPU:
#!/usr/bin/perl
$response = `/var/www/cacti/scripts/check_vmware_api.pl -H $ARGV[0] -u root -p $ARGV[1] -l cpu`;

chomp $response;

($load) = ($response =~ /cpu_usage=(\d+\.\d\d)\%/);
print «$load\n»;
Memory:
#!/usr/bin/perl
$response = `/var/www/cacti/scripts/check_vmware_api.pl -H $ARGV[0] -u root -p $ARGV[1] -l mem`;

chomp $response;

($load) = ($response =~ /mem_usage=(\d+\.\d\d)\%/);
print «$load\n»;
Grid:
#!/usr/bin/perl
$response = `/var/www/cacti/scripts/check_vmware_api.pl -H $ARGV[0] -u root -p $ARGV[1] -l net`;

chomp $response;

($receive) = ($response =~ /receive=(\d+\.\d\d)\KB/);

($send) = ($response =~ /send=(\d+\.\d\d)\KB/);
print «receive:$receive send:$send\n»;
VMFS:
#!/usr/bin/perl
$response = `/var/www/cacti/scripts/check_vmware_api.p-H $ARGV[0] -u root -p $ARGV[1] -l vmfs -s USAGE`;

chomp $response;
$response =~ tr/(«(«//d;
($load) = ($response =~ /MB (\d+\.\d\d)\%/);
print «$load\n»;
We create a new Device
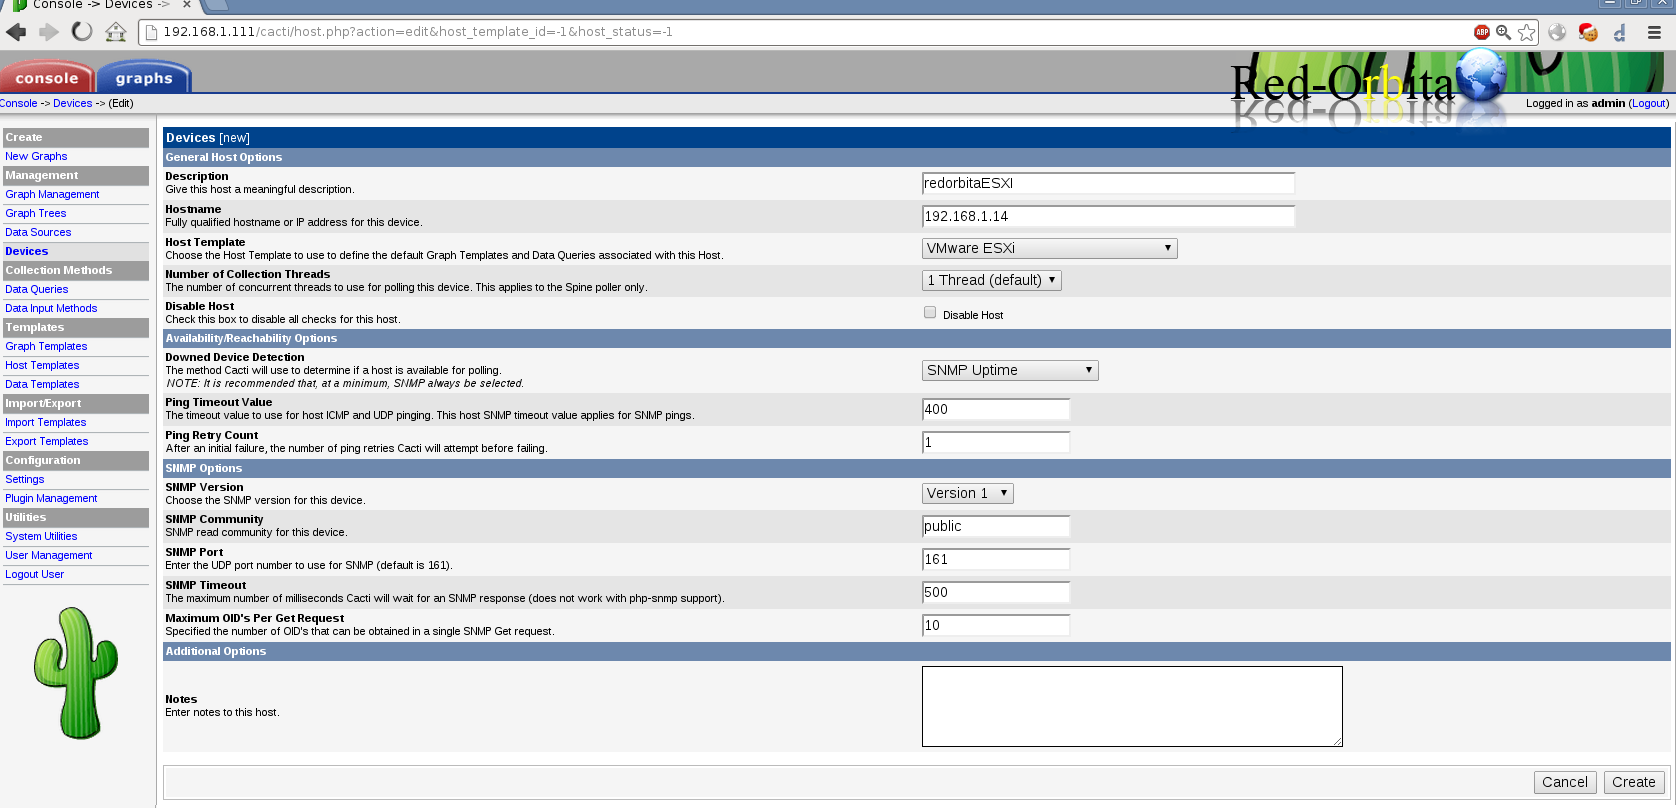
Once added we give Create Graphs for this Host and we add the checks.
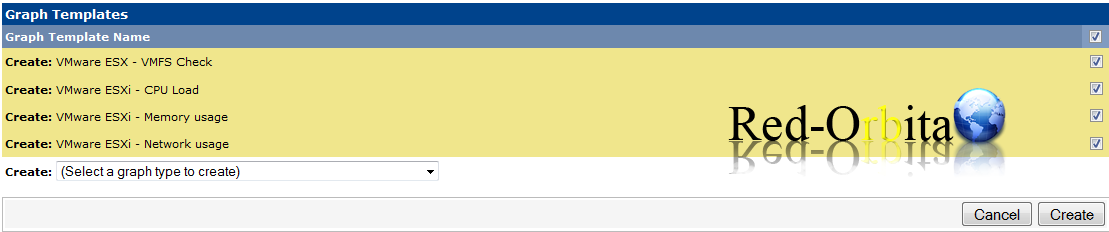
We fill in the fields with the root password and vcenter user and password,
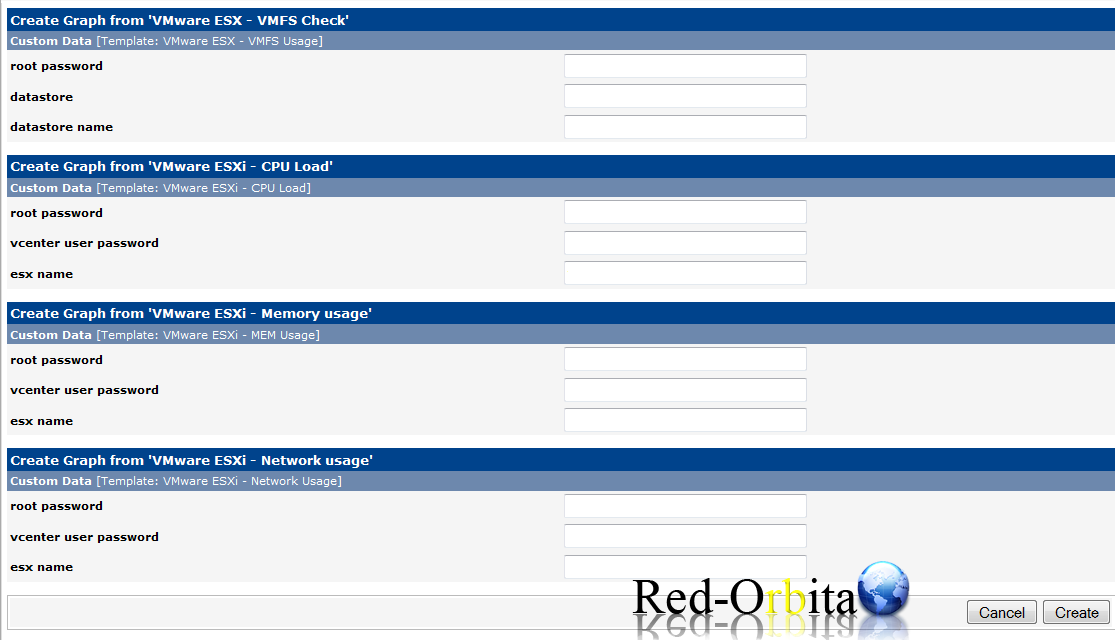
Ready, once added to the project tree the new Device should graph correctly.
Regards, Rokitoh
:wq!
Comments